Calculate how roadway expansions lead to more traffic
Nov 30, 2021
It’s been said that Hawaii’s strategy for solving its traffic-congestion problems fits the definition of insanity. Or at least fits the part of the definition referring to doing the same thing over and over for decades and expecting a different result at some point in our repetitiveness.
In terms of Hawaii’s roadways, this is the result of adherence to the phenomenon of induced demand, a belief that if more roads are built to decrease traffic congestion, then traffic will in turn decline. Building more roads has instead led to short-term ease of congestion and greater use of our roadways long-term as travel demand grows proportional to added capacity.
Some positive news? A new calculator now gives advocates ammunition to show real-world impacts of proposed highway expansions in their communities with data and information. Advocates hope that state and county transportation agencies will also be required to use this valuable calculating tool in the future.
It’s called a State Highway Induced Frequency of Travel (SHIFT) calculator. Created by the sustainability-focused energy organization RMI, it allows users to estimate long-run induced vehicle miles traveled (VMT) and emissions impacts resulting from capacity expansions of large roadways. The calculations are based on existing lane mileage and VMT data from the Federal Highway Administration.
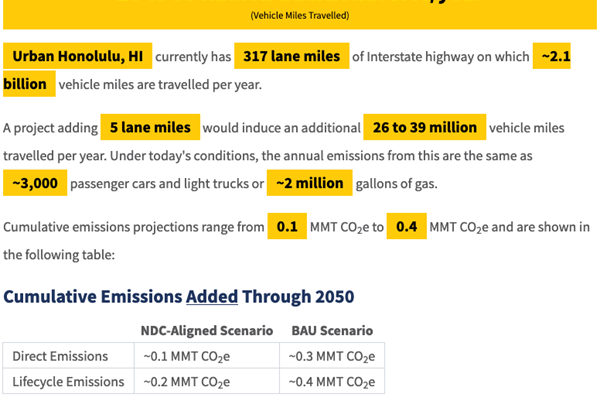
We tried it, inputting just five miles of lane to interstate highways in Honolulu into the SHIFT calculator to determine the induced demand. It calculated that the addition of five lane miles to our freeways would induce an additional 26-39 million VMT per year. According to the SHIFT calculator, those additional miles traveled would equate to the current annual emissions of 3,000 passenger cars and light trucks, or 2 million gallons of gas.
Uh-huh, we were pretty surprised by the info, too.
Because the SHIFT calculator uses factors drawn from studies that consider the impacts of road widenings over hundreds of observations and many years to arrive at its net impact results, it is best used as a tool to understand order-of-magnitude impacts rather than precise, project-specific outcomes. But it does provide a more informed understanding of the impacts of road expansions. And the data it provides is indeed eye-opening.
Adding more and more lanes to our roadways, especially at the expense of a more comprehensive multimodal transportation system, is a losing strategy. In its 2020 report “The Congestion Con,” Transportation for America, a U.S. organization supporting progressive transportation and land-use policy, analyzed data from the largest 100 urbanized areas in the U.S. Its data revealed that 30,511 new freeway lane-miles were added in these areas between 1993 and 2017 — an increase of 42%, and greater than the 32% growth in population in these areas over the same time period.
To check out and give the SHIFT calculator a spin, visit https://shift.rmi.org.